Using the Internet to Track Social Distancing
By Priscilla Zheng
Social distancing became an overnight buzzword as governments around the world began prohibiting unnecessary gatherings in public. The term really just applies to physical gatherings as our interactions online and on social media are what keep us connected. In the advertising industry, we understand the significance and benefits of utilizing data. It is no surprise that data will be at the forefront of our perseverance through the COVID-19 pandemic.
Here are a few ways major tech companies are utilizing data:
The social media giant expanded their “Facebook Data for Good” program to provide more tools for nonprofits, researchers, and the general public to use. The program includes:
Population Density Heat Maps – These show the geographic distribution of populations for 169 countries. They are even able to filter specific demographics such as age. Organizations, like the World Bank, have used these tools to pinpoint areas that need resources and help during this pandemic.
Disease Prevention Maps – There are various types of maps that show data concerning the movement of people. They even show whether people are staying at home or travel to certain locations; this helps to determine which “stay-at-home” policies are working best. It can also help predict where more COVID-19 cases may appear next.
Social Connectedness Index – This tool shows how connected two geographic regions are based on Facebook friendships. The index reveals information on economic opportunities, social mobility, trade, and now the socio-economic impacts from COVID-19.
Facebook stresses that individuals’ privacy will not be violated. For more information, visit dataforgood.fb.com/docs/covid19.

The distribution of people over the age of 60 in Mexico.
CrowdTangle
A social network monitoring and content discovery tool, CrowdTangle collects and organizes current news articles and social media posts on their Coronavirus Live Displays to highlight what is trending. The displays can be viewed on a global, country, and even a state-by-state (for the United States) perspective. There is also a “Positive & Heartwarming Stories” section if you need content to brighten up your quarantined day.
For more information, visit apps.crowdtangle.com/public-hub/covid19.
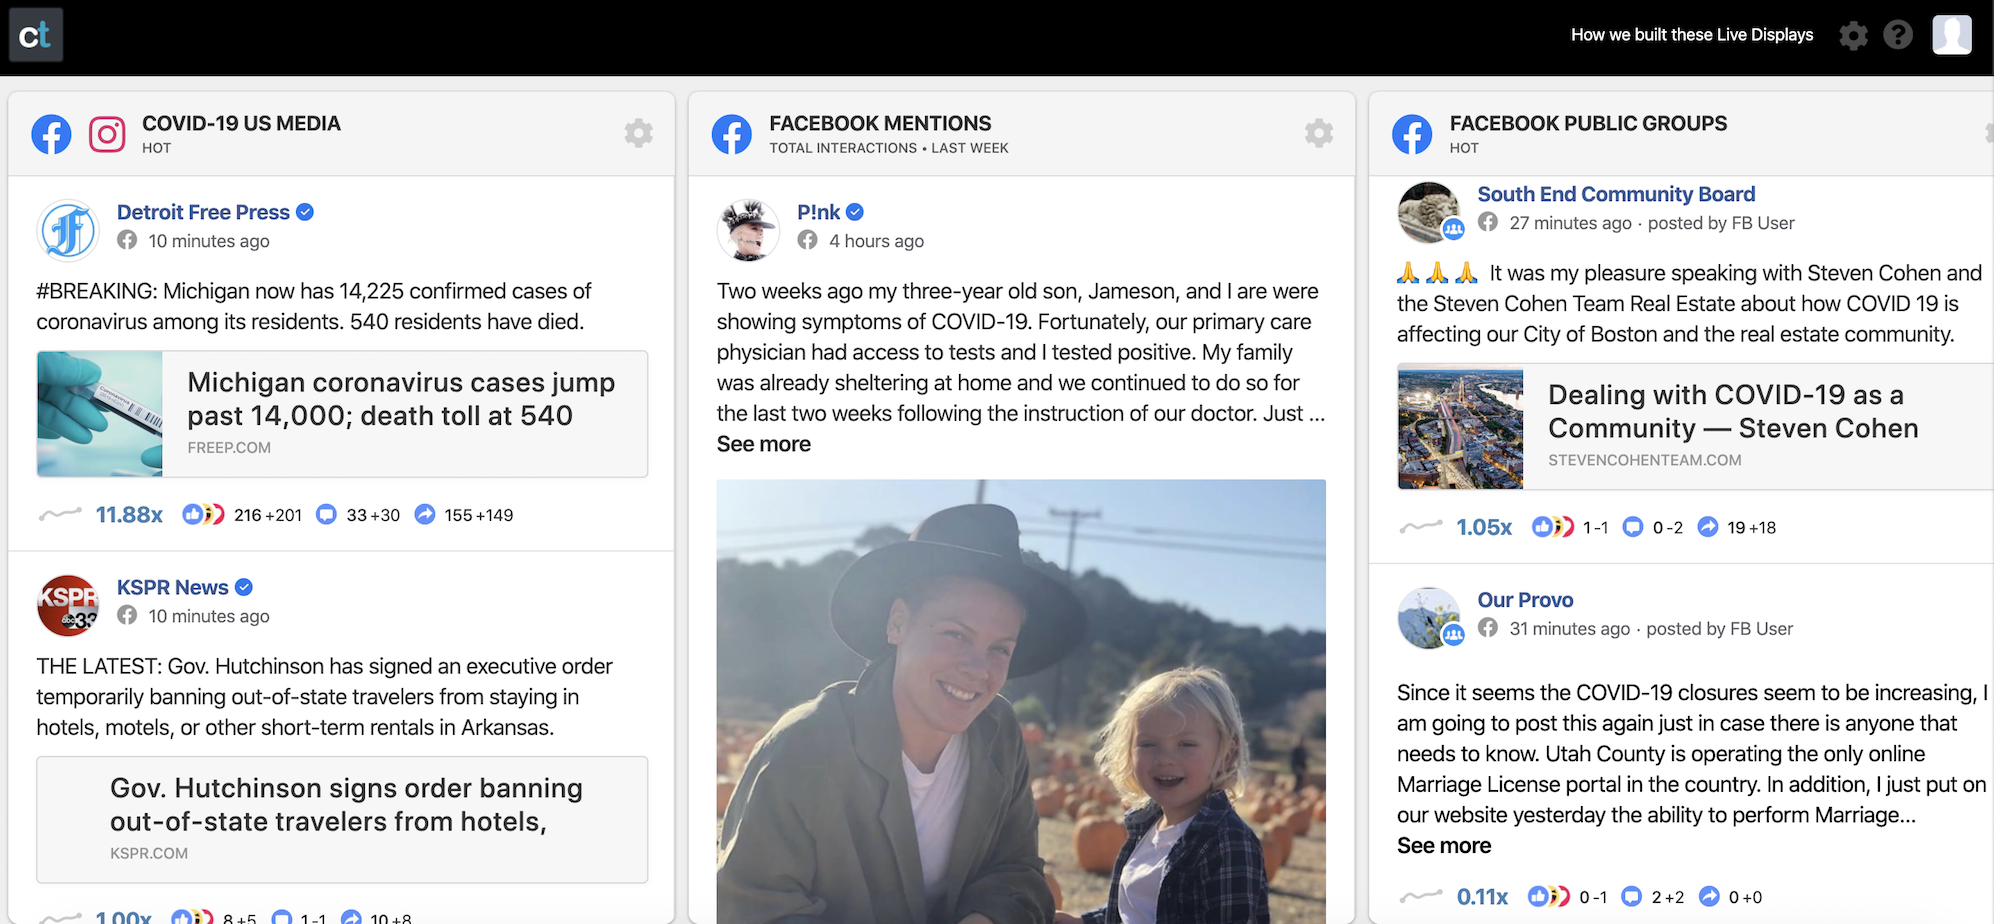
An example of a CrowdTangle feed.
The search engine is utilizing data in a multitude of ways, but one report that stands out is the Community Mobile Report. It is a great overview of how foot traffic has changed for different aspects of daily life such as retail, transit, recreation, and more. There are reports for almost every country and even a state-by-state breakdown for the United States. The Hawaii report is broken down by county as well. As of April 5th, Hawaii saw a 55% decrease in traffic for retail and recreation, a 76% decrease for transit stations, and a 16% increase for residential areas.
For more information, visit www.google.com/covid19/mobility.
Hawaii’s Community Mobility Report: www.gstatic.com/covid19/mobility/2020-04-05_US_Hawaii_Mobility_Report_en.pdf

An example Google’s Community Mobility Report.
Unacast
Unacast is a mobility data aggregator that provides information to a variety of industries including retail, real estate, travel, and marketing. Their COVID-19 Toolkit includes a Social Distancing Scorecard that rates how states (and counties) are doing in terms of reducing average mobility and nonessential encounters. Honolulu received a C, Kauai and Maui received a B+, and Hawaii Island received a B-. Unacast is set to release a Retail Impact Scorecard and Origin-Destination Flux report soon.
For more information, visit www.unacast.com/covid19.

A sample of Unacast’s first tool in their Toolkit: a Social Distancing Scoreboard.
Imperva Research Labs
Imperva is focused on monitoring internet traffic during this pandemic. There is an increase in web traffic for industries such as news (+64%), food & beverage (+34%), retail (+28%), and gaming (+28%). Decreases in internet traffic were found in the sports (-46%), travel (-41%), and automotive (-35%) industries. Imperva warns businesses with increased web traffic should beware of cybercriminals who may target consumers and employees that are working from home.
For more information, visit www.imperva.com/blog/COVID-19-surge-in-online-traffic-increases-risk.